A bar chart displays series as sets of horizontal bars. The plain bar
chart is closely related to the column chart, which displays series as
sets of vertical bars, and the range bar chart, which displays series as
sets of horizontal bars with varying beginning and end points.
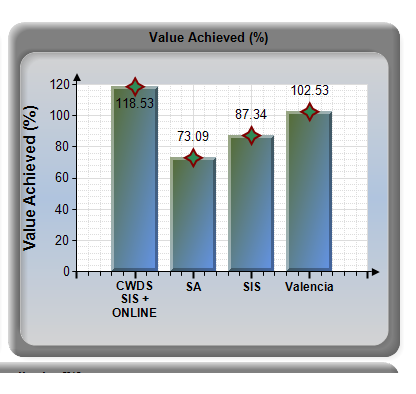
The bar chart is the only chart type that displays data horizontally. For this reason, it is popular for representing data that occurs over time, with a finite start and end date. It is also popular for showing categorical information since the categories can be displayed horizontally. For more information about how to add data to a bar chart, see Charts (Report Builder and SSRS).
The following illustration shows a bar chart. The bar chart is well suited for this data because all three series share a common time period, allowing for valid comparisons to be made.

Variations of the Bar Chart
-
Stacked. A bar chart where
multiple series are stacked vertically. If there is only one series in
your chart, the stacked bar chart will display the same as a bar chart.
-
Percent stacked. A bar chart
where multiple series are stacked vertically to fit 100% of the chart
area. If there is only one series in your chart, all the bars will fit
to 100% of the chart area.
-
3D clustered. A bar chart that shows individual series in separate rows on a 3D chart.
-
3D cylinder. A bar chart that shapes the bars as cylinders on a 3D chart.
-
Bar charts have their axes reversed. The category axis is
the vertical axis (or "y-axis") and the value axis is the horizontal
axis (or "x-axis"). This means that in a bar chart, you have more space
for category labels to be displayed along the y-axis as a list that
reads from top to bottom.
-
Bar and column charts are most commonly used to show
comparisons between groups. If more than three series are present on the
chart, consider using a stacked bar or column chart. You can also
collect stacked bar or column charts into multiple groups if you have
several series on your chart.
-
A bar chart displays values from left to right, which may be more intuitive when displaying data related to durations.
-
If you are looking to add bars to a table or matrix
within the report, consider using a linear gauge instead of a bar chart.
The linear gauge is designed to show one value instead of multiple
groups, so it is more flexible for use within a list or table data
region. For more information, see Gauges (Report Builder and SSRS).
-
You can add special drawing styles to the individual bars
on a bar chart to increase its visual impact. Drawing styles include
wedge, emboss, cylinder, and light-to-dark. These effects are designed
to improve the appearance of your 2D chart. If you are using a 3D chart,
the drawing styles will still be applied, but may not have the same
effect. For more information about how to add a drawing style to a bar
chart, see Add Bevel, Emboss, and Texture Styles to a Chart (Report Builder and SSRS).
-
Stacked bar charts place series on top of each other to
create one bar stack. You have the option of separating the stacked bar
chart into multiple sets of stacks for each category. The grouped
stacked chart is displayed side-by-side. You can have any number of
grouped stacked series in a chart.
-
When data point labels are shown on a bar chart, the
labels are placed on the outside of each bar. This can cause labels to
overlap when the bars take up all of the allotted space within the chart
area. You can change the position of the data point labels displayed
for each bar by setting the BarLabelStyle property in the Properties pane.
-
If there are a lot of data points in your dataset
relative to the size of your chart, the size of the columns or bars and
the spacing between them are reduced. To manually set the width of the
columns in a chart, modify their width, in pixels, by modifying the PointWidth
property. By default, this property has a value of 0.8. When you
increase the width of the columns or bars in a chart, the space between
each column or bar decreases.
No comments:
Post a Comment